One mystery shop tells you how Riley did today. Trends, schedules, and run history tell you whether call quality is holding steady, improving, or quietly drifting - which is the question that actually matters over months of real calls.
Put mystery shops on a schedule
On the Mystery shop page (/dashboard/shop/mystery-shop), set the Schedule control to Off, Daily, or Weekly, and pick your timezone. Scheduled runs happen automatically - no need to remember to dial.
- Weekly is the right default for most shops: enough data to see drift, without cluttering your Calls list.
- Daily is useful while you're actively tuning - right after go-live, or while fixing a recurring rubric failure.
Read the Trends page
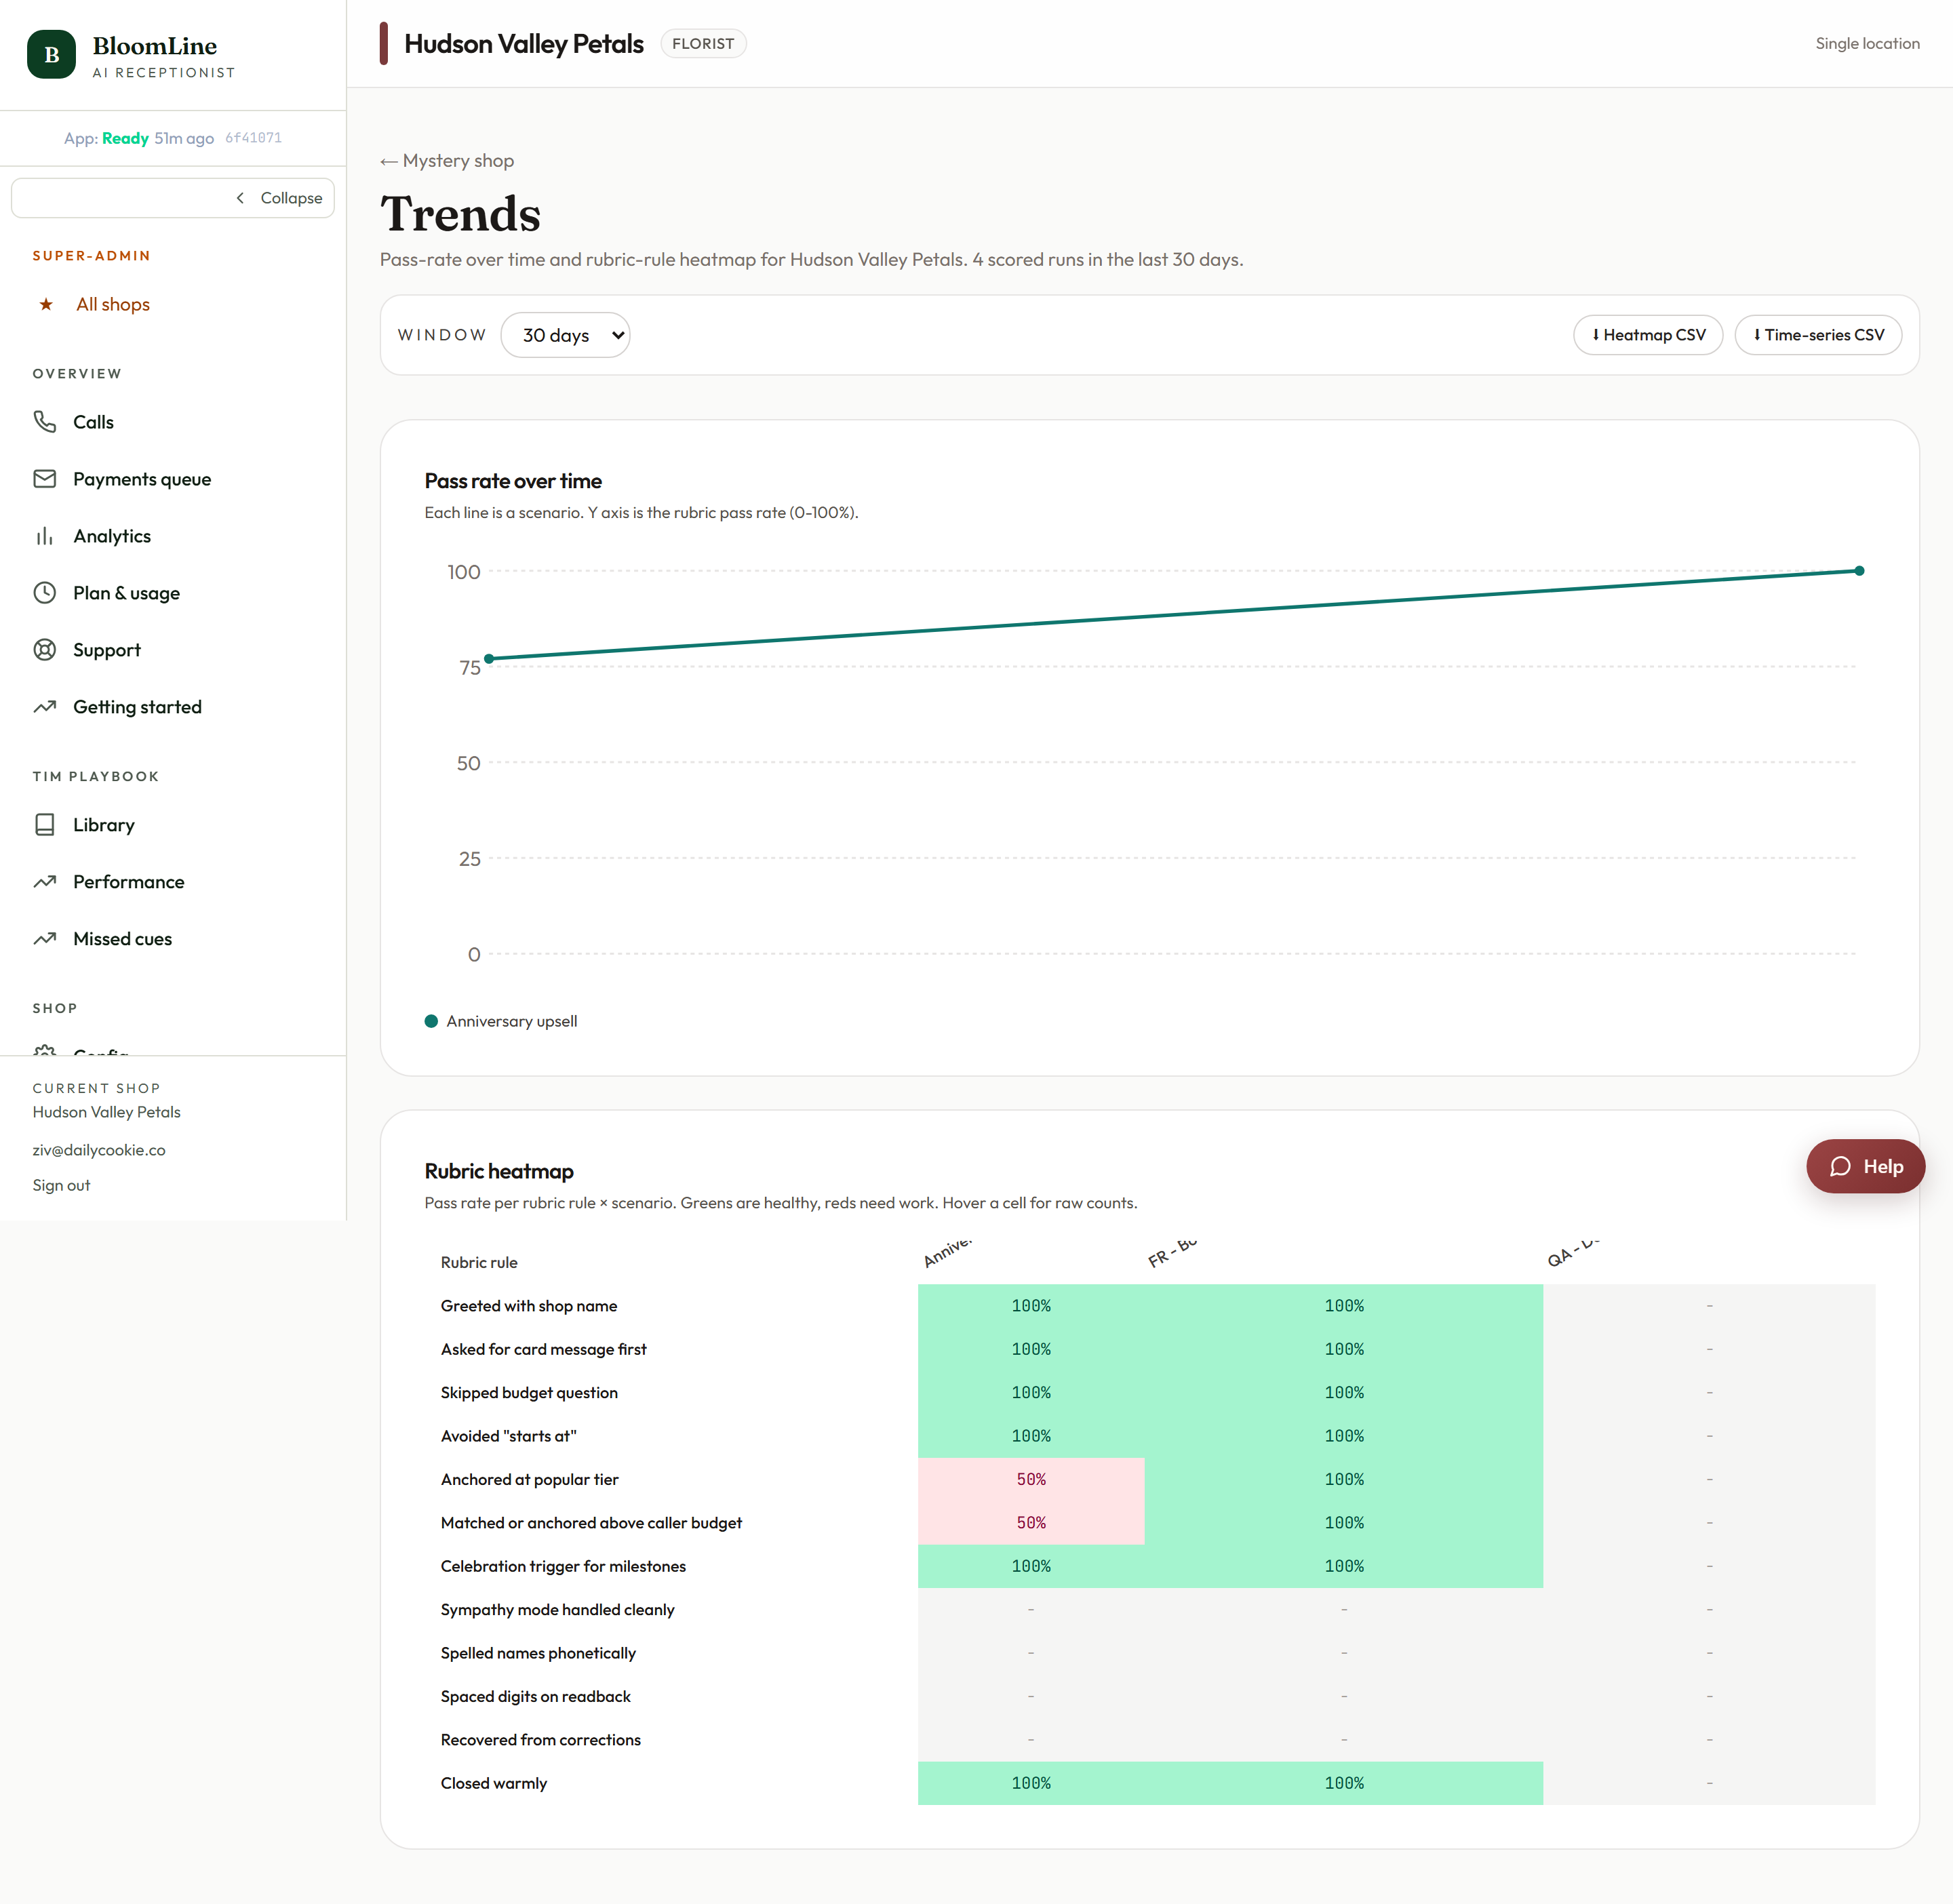
Open Trends from the Mystery shop page (/dashboard/shop/mystery-shop/trends). Two views summarize every run:
- Pass rate over time: a chart of how your rubric pass rate is moving. A steady or rising line means your changes are working. A dip right after you changed a greeting or a sales play is your cue to review that change.
- Rubric heatmap: pass/fail across all 12 rubric rules over your runs. Reading down a column shows you which specific rules keep failing - that's where to focus, rather than on the overall score.
Use the window selector to zoom: 7 days, 30 days, 90 days, 1 year, or all time. If you run multiple locations, the shop selector switches the view between shops.
Dig into one scenario's history
Every scenario has its own detail page (open it from the Mystery shop page). There you'll find:
- Run history: every time this scenario was dialed, with each run's result.
- Compare two runs: pick any two runs side by side. This is the cleanest way to verify a fix - compare the run before your change against the run after, and see exactly which rubric rules flipped from fail to pass.
A simple quality routine
- Set the schedule to Weekly.
- Once a week, glance at the pass rate chart on Trends. Flat or rising: you're done in ten seconds.
- If the line dips, open the heatmap, find the failing rule, and fix the setting behind it (greeting, knowledge, hours, or the relevant sales play).
- Re-run the affected scenario manually and use the compare picker to confirm the fix.
Still stuck? Submit a ticket from this help center and we'll take it from there.
Was this article helpful?
That’s Great!
Thank you for your feedback
Sorry! We couldn't be helpful
Thank you for your feedback
Feedback sent
We appreciate your effort and will try to fix the article